Exporting data and figures
Alambic has an interesting feature that enables users to re-use generated content on external web sites. This is especially useful for the pictures generated by plugins. There are three main types of exportable plots: simple pictures (e.g. png), html snippets, and plot.ly graphics.
The complete list of plots that can be exported for a project is listed in the instance's documentation (Documentation > Data).
Simple pictures
The format is as follows:
<img src="<server:port>/projects/<project_id>/<plugin_id>/<image.svg>"
     alt="My picture" />
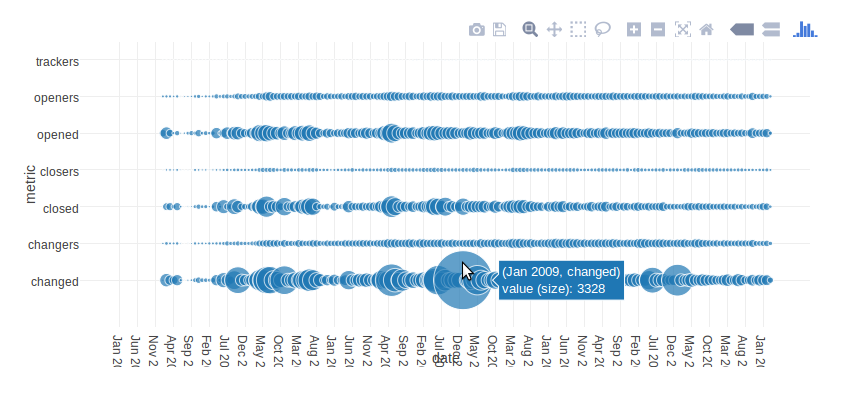
As an example the following picture is borrowed from the Alambic instance dedicated to Eclipse projects, located at eclipse.castalia.camp. It uses the Bubble plot of questions from the stack overflow plugin of the CDT (tools.cdt) project. You can see the picture itself here.
<img src="http://eclipse.castalia.camp/projects/tools.cdt/StackOverflow/so_plot.svg"
     alt="Bubble plot of Stack Overflow questions" />
HTML snippets
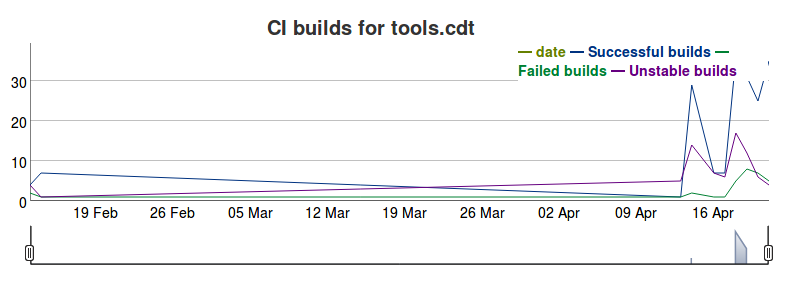
HTML snippets are usually interactive, js-based plots: they allow the user to either zoom, crop or select traces, depending on the type of plot. Most HTML snippets provided here use htmlwidgets. The widgets actually used include dygraphs and metricsgraphics, but other visualisations may be used easily too, see the htmlwidgets documentation.
Using HTML snippets is as simple as inserting a iframe element in your web page, with the address of the plot as a target. Width and height depend on the plot, so you may need to adjust them. If in doubt, you can still check the plugin page for the project (which uses iframes too) and see what dimensions are used.
An example of iframe for project CDT is provided below:
<iframe src="http://eclipse.castalia.camp/projects/tools.cdt/Hudson/hudson_hist.html"
    frameborder="0" style="width: 100%; height: 300px">
</iframe>
This iframe would show the following visual when reused:
Plot.ly graphics
Plot.ly is a (software as a) service that enables users to easily play and present data in an on-line, fully-featured dashboard. Plot.ly graphics have a set of icons in the upper-right corner of the picture, which allow users to (from left to right):
- Download the plot as a png file
- Edit the plot online on plot.ly
- Zoom on a box
- Select (box and lasso)
- Zoom in / Zoom out
- Zoom (autoscale)
- Reset axes (usually boilds down to the autoscale)
- Select method (point or group of points)
Plot.ly figures can be exported and reused just as the HTML snippets (which they are btw). Just insert an iframe in your own web page with the plot as a target. It would look like:
<iframe src="http://eclipse.castalia.camp/projects/modeling.sirius/Git/git_evol_summary.html"
        frameborder="0" style="width: 100%; height: 370px">
</iframe>