Alambic main features
A single place for all development data

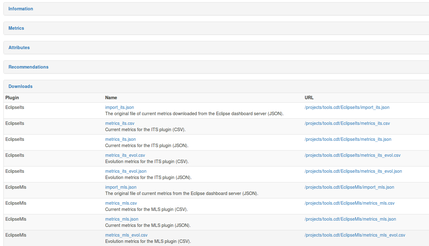
Centralise all project development data in a single place in ready-to use formats (CSV, JSON). Generated data sets can easily be downloaded for futher investigation, and generated figures can be exported in an external web site. Dashboard applications like plot.ly or Liferay can easily reuse data and graphics to create personalised perspectives.
Quality model & Recommendations
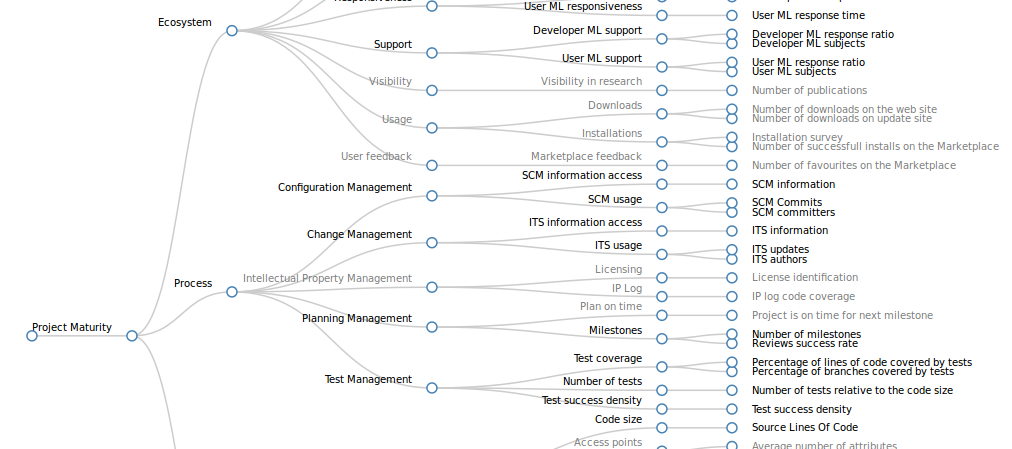
Measures are aggregated in a tree-like quality model structure to better organise and understand the information. The Quality model can be entirely customised, and almost any type of data source can be added through plugins.
Plugins emit recommendations that allow team members and users to easily pick up the next right thing to do, thus enabling steady and practical improvement of practices for the team and quality for the project.

An extensible plugin system

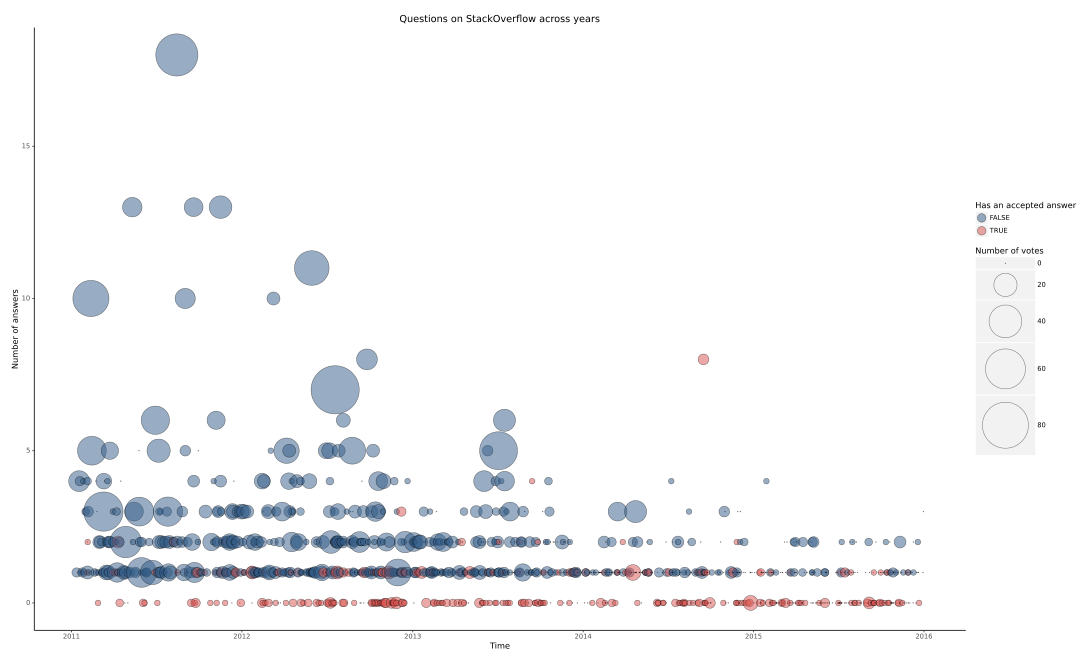
A flexible plugin system allows to easily add new data sources (e.g. git or svn logs, bugzilla queries), analysis tools (including R scripts), visualisation and reporting (e.g. knitr or plotly graphs). Examples of plugins ready to use include PMD Results Analysis, StackOverflow questions and PMI Checks for Eclipse projects.
Plugins provide nice visualisation, adapted to the context of software engineering. Visualisation can easily be exported and reused on external web sites (html snippets, png, jpeg, svg), in third-party data munging tools (e.g. Tableau, Plotly, Excel) or in dashboards (e.g. liferay, plotly).