Dashboard > Quality Model
This page displays a nice visualisation of the quality model, with all attributes and metrics. When clicking on a node, the documentation for that node is displayed on the right (or below depending on the size of the screen, responsive powah..).
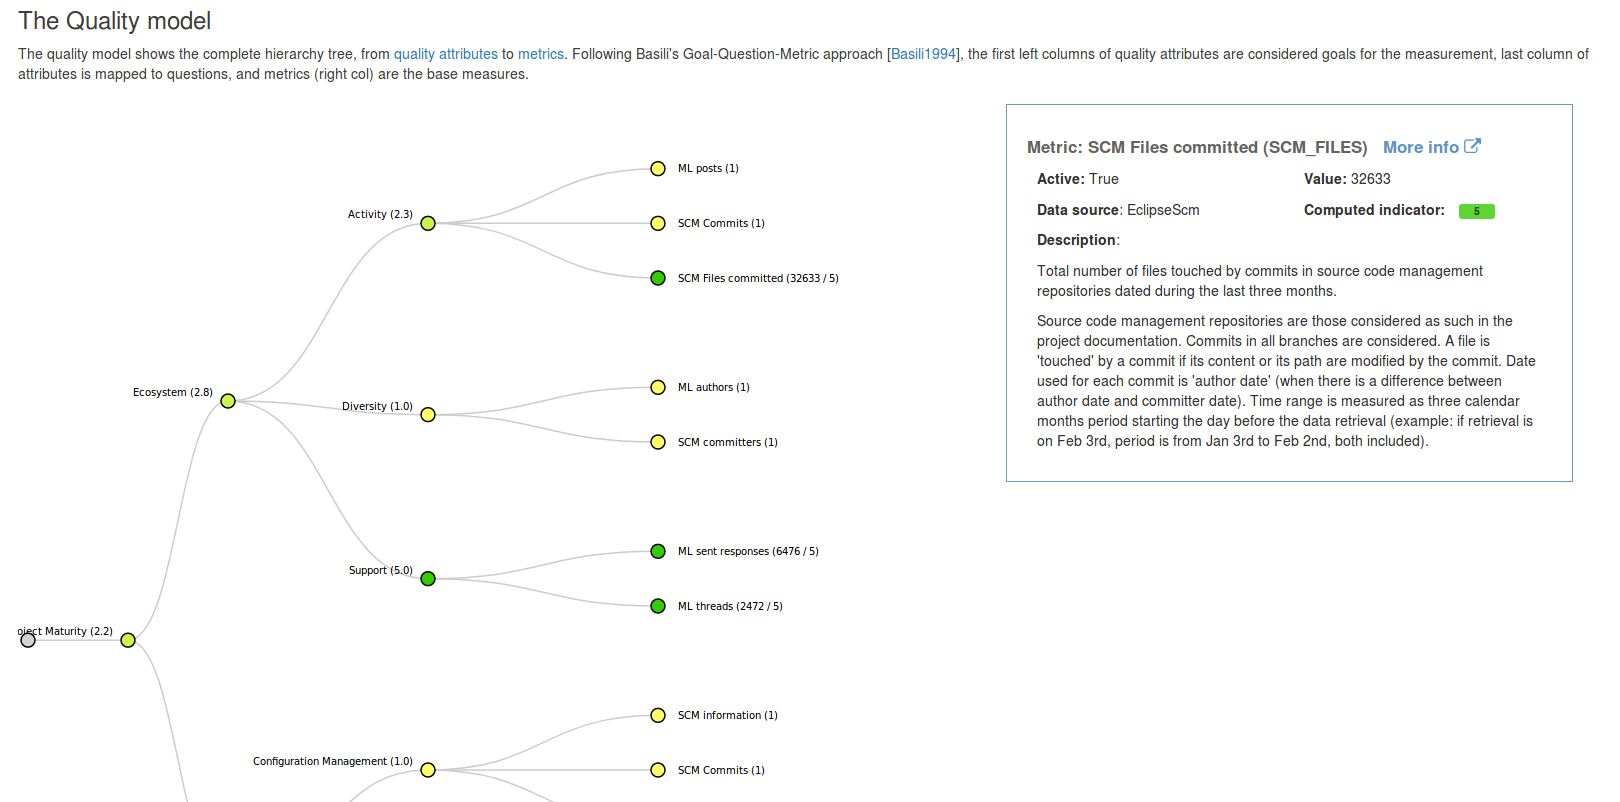
Nodes are coloured according to the attribute's (or indicator's) value, from yellow (poor) to green (good). Value of attributes, indicators and metrics are displayed next to the node's name.
The detailed information panel displays all available information about the selected node: name, ID, data plugin source, value (including computed indicator for metrics), description, and a link to the documentation section for this node.